Task Component
This section describes Rally Task Component (including feature presented since Rally v0.5.0, allowing to analyze statistics trends for the given tasks).
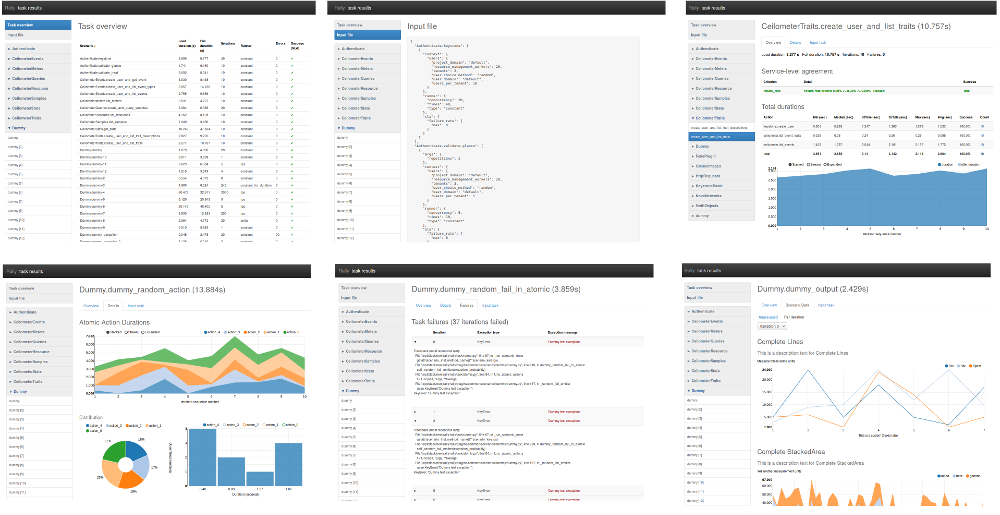
HTML Reports
HTML reports provide comprehensive analysis. Data is structured and displayed interactively, with charts and tables.
Task Report
Get the whole information about task workloads results, in pretty and convenient format!
Generate report for single task, using task UUID
Having a finished task, generate report with command:
$ rally task report <task-uuid> --out <report-file>
Example:
$ rally task report 6f63d9ec-eecd-4696-8e9c-2ba065c68535 --out report.html
Generate report for single task, using JSON file
Report can be generated from a task results JSON file. This file can be generated with command rally task results:
$ rally task results 6f63d9ec-eecd-4696-8e9c-2ba065c68535 > results.json
$ rally task report results.json --out report.html
Generate report for many tasks
Report can be generated from many tasks. All workloads from specified tasks results will be composed into an entire report. To generate report, use –tasks argument with specified list of tasks UUIDs and/or tasks results JSON files.
Example:
$ rally task report --tasks 6f63d9ec-eecd-4696-8e9c-2ba065c68535 20ae7e95-7395-4be4-aec2-b89220adee60 a5737eba-a204-43d6-a262-d5ea4b0065da results.json another_results.json --out report.html
Task Overview
This is a table with brief summary of all workloads results. All columns are sortable and clickable.
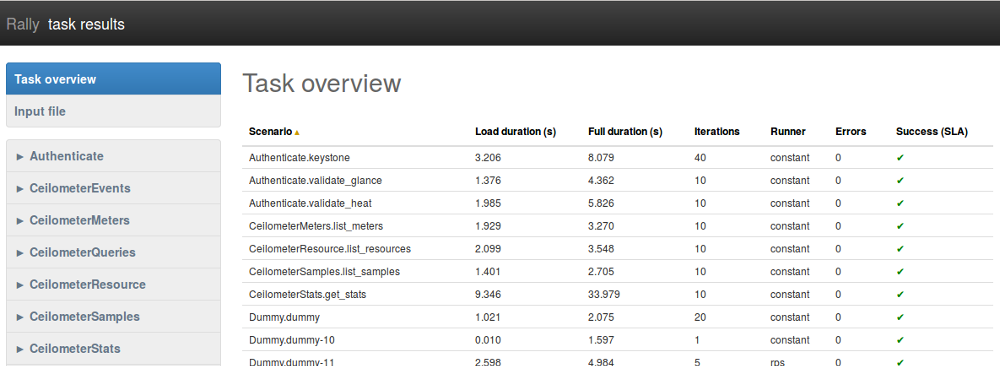
Load duration
Time from first iteration start to last iteration end. In other words, this is a time of all workload iterations execution.
Full duration
This time includes iterations time (Load duration) plus time taken by another actions related to the task, mostly Contexts execution time.
Iterations
How many times the workload has run. This comes from the value of runner.times in task input file.
Failures
Number of failed iterations. Failure means that there was an Exception raised.
Success (SLA)
This is a boolean result of workload SLA. See Service-level agreement explanation below.
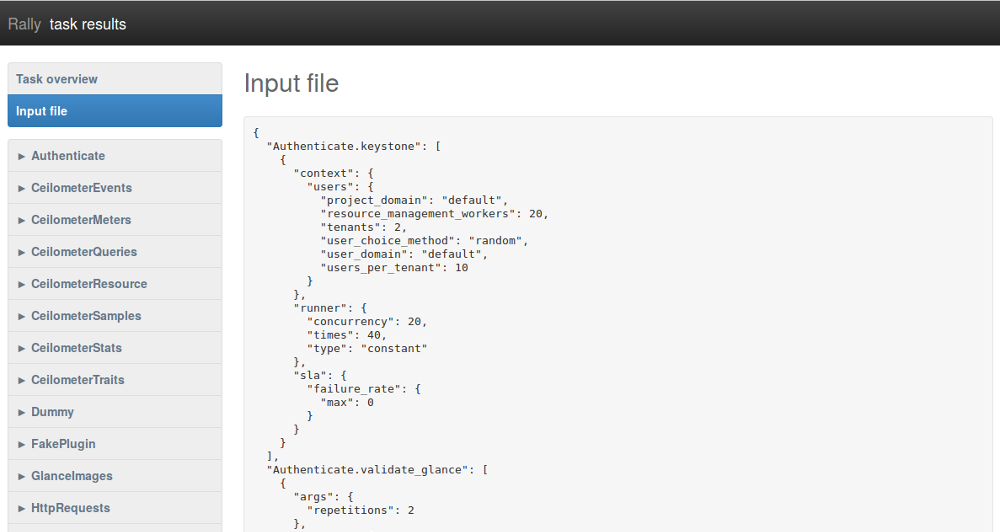
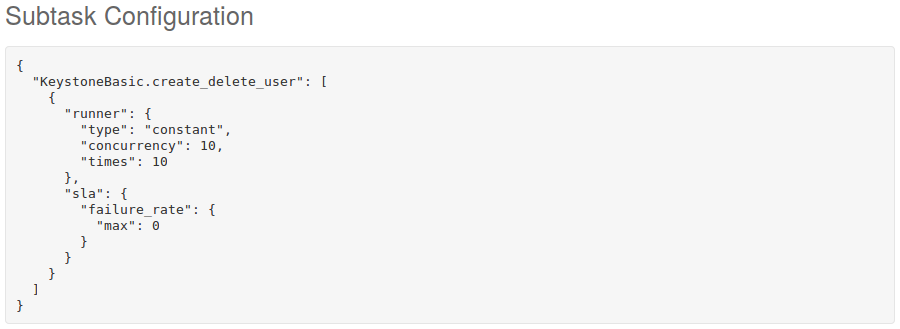
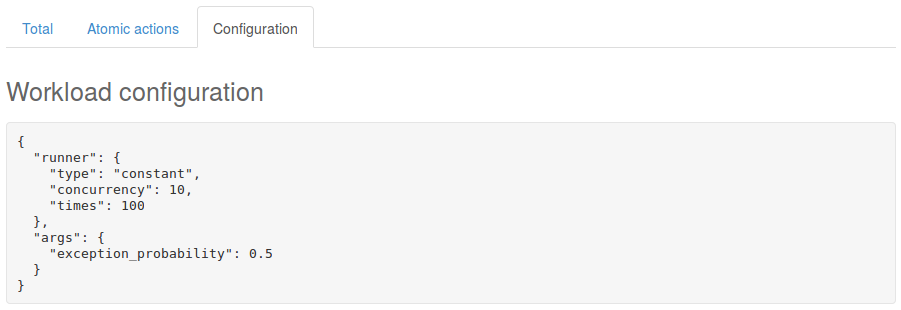
Input file
This shows JSON which can be used to run a task with exactly the same workloads list and configuration. This is not an exact copy (neither concatenation) of actually used input files (in command rally task start), however this is exactly what is needed to run workloads given in the report.
Tab «Overview»
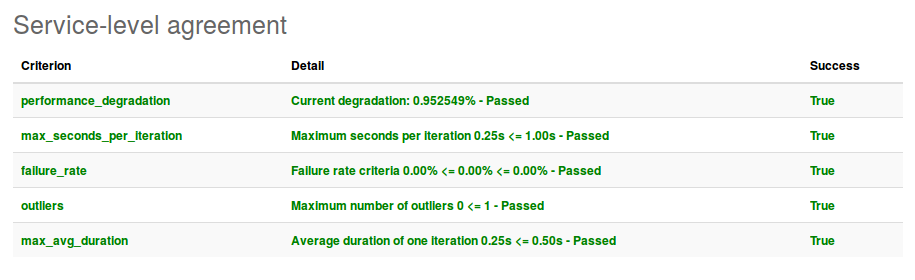
Service-level agreement
SLA results appear in task report only if “sla” section is defined in task input file.
For example, having this in task input file:
"sla": {
  "performance_degradation": {
    "max_degradation": 50
  },
  "max_seconds_per_iteration": 1.0,
  "failure_rate": {
    "max": 0
  },
  "outliers": {
    "max": 1,
    "min_iterations": 10,
    "sigmas": 10
  },
  "max_avg_duration": 0.5
}
will result SLA section similar to the following:
What if workload has no “sla” configuration in input file?
If “sla” section is missed in input file, then block Service-level agreement is not displayed and its result is assumed to be always passed (no matter how many failures occurred).
Total durations
There is a durations analysis, which is represented by statistics table and duration StackedArea chart.
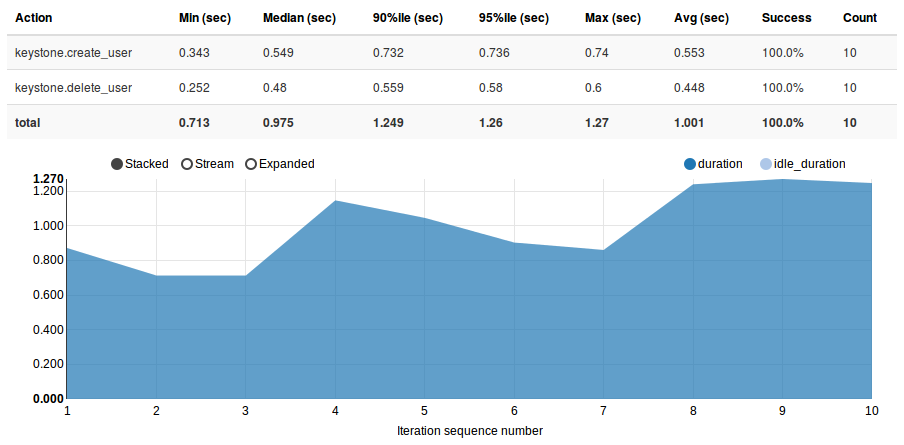
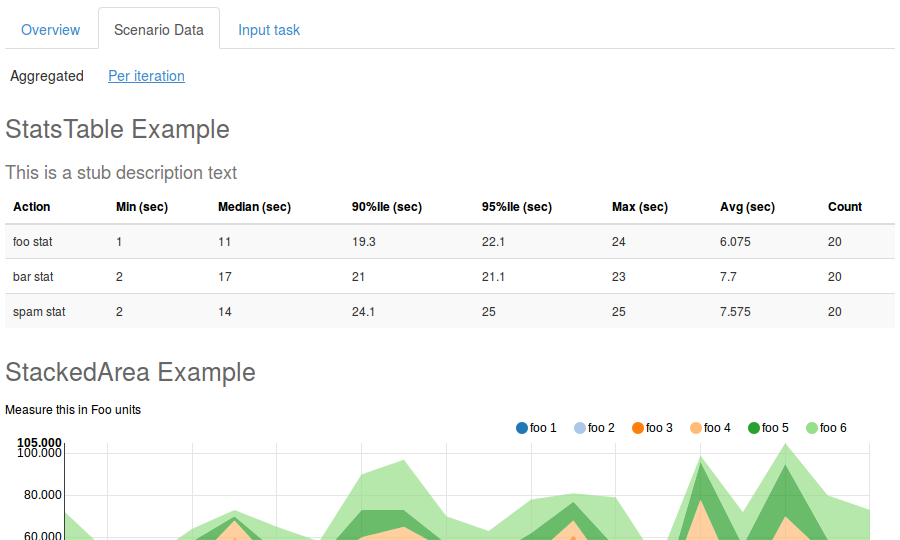
Table with statistics data
- Action
- Name of the workload metric that has some duration saved. This is either an atomic action name or Total which points to workload load duration.
- Min (sec)
- Minimal duration value
- Median (sec)
- Median duration value
- 90%ile (sec)
- Percentile for 90% durations
- 95%ile (sec)
- Percentile for 95% durations
- Max (sec)
- Maximal duration value
- Avg (sec)
- Average duration value
- Success
- Percent of successful runs. This is how many percent of this action runs (number of runs is given in Count column) were successful.
- Count
- Number of actually run atomic actions. This can differ from iterations count because some atomic actions do not start if some exception is raised before in the workload runtime (for example in previous atomic action).
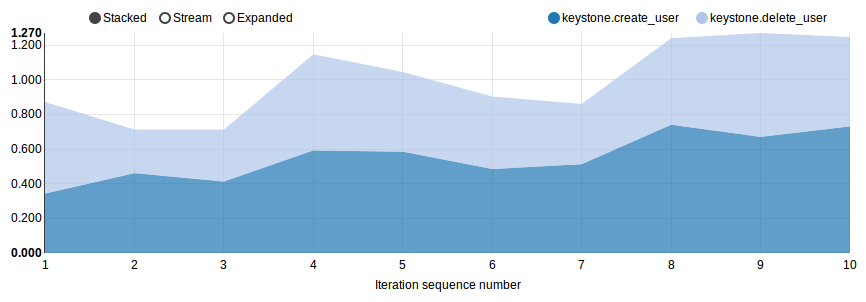
StackedArea with durations per iteration
This chart shows load_duration and idle_duration values per iteration. If there is only one iteration, then chart is useless so it is hidden.
Idle duration
Sometimes workload does nothing for some reason (waiting for something or just making a dummy load). This is achieved by calling time.sleep() and spent time is called idle duration.
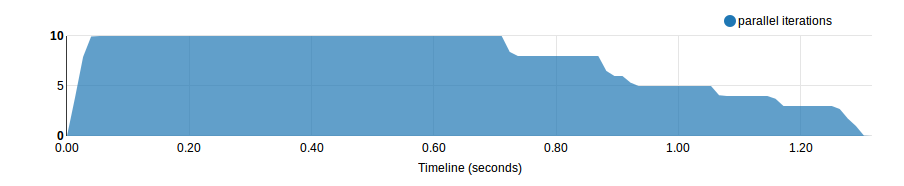
Load Profile
Load profile chart shows number of iterations running in parallel for each workload moment:
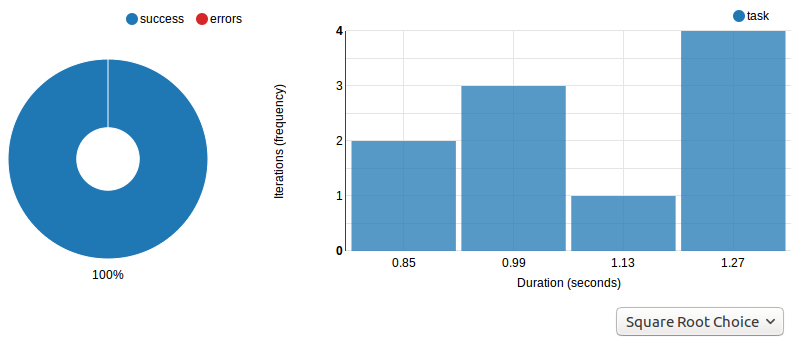
Distribution
Pie chart shows percent of successful and failed iterations.
Histogram shows durations distribution with the following methods (selected in dropdown list): Square Root Choice, Sturges Formula, Rise Rule
Tab «Details»
Atomic Action Durations
There is a StackedArea chart that shows atomic actions durations per iteration. If there is only one iteration, then chart is useless so it is hidden.
Distribution
Distribution for atomic actions durations
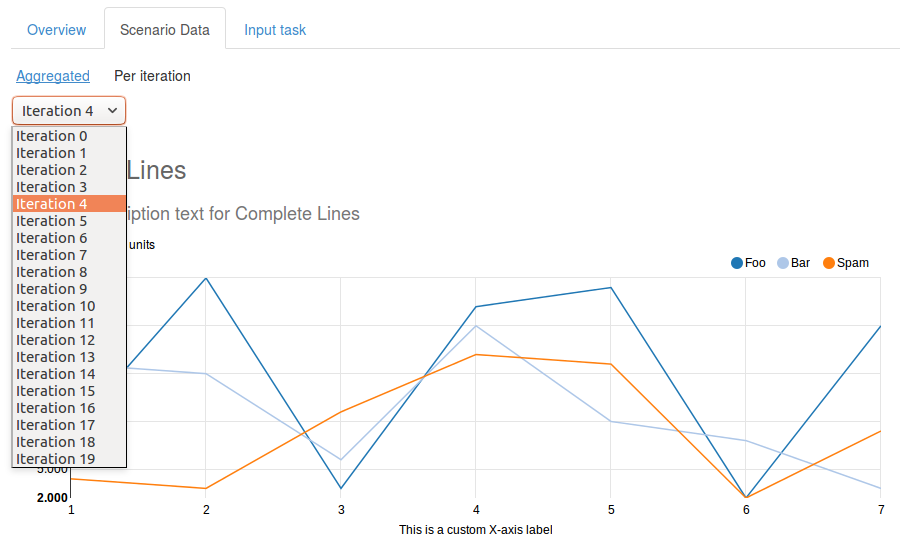
Tab «Scenario Data»
This tab only appears if workload provides some custom output via method Scenario.add_output().
Aggregated
This shows charts with data aggregated from all iterations. This means that each X axis point represents an iteration, so each iteration provided some values that are aggregated into charts or tables.
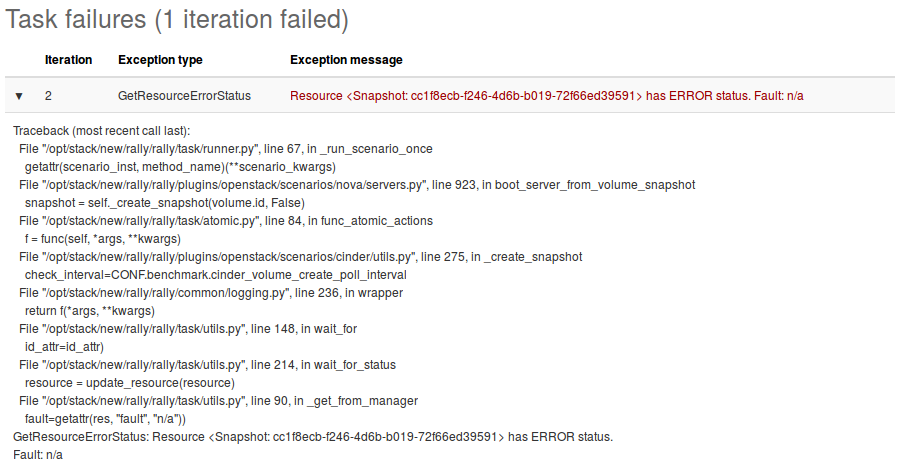
Tab «Failures»
Complete information about exceptions raised during the workload run
- Iteration
- Number of iteration where exception is occurred
- Exception type
- Type of raised Exception subclass
- Exception message
- Message delivered by the exception
Click on a row expands it with exception traceback.
Trends Report
If same workload is run several times, some results of these runs can be compared. Compared metrics are success rate (percent of successful iterations) and statistics for durations.
How to generate trends report
Use command rally task trends with given tasks UUIDs and/or tasks results JSON files and the name of desired output file.
Example:
$ rally task trends --tasks 6f63d9ec-eecd-4696-8e9c-2ba065c68535 a5737eba-a204-43d6-a262-d5ea4b0065da --out trends.html
What is an order of workload runs?
Workload run number in shown on charts X axis, the order of runs is exactly as it comes from tasks data in the moment of report generation.
Trends overview
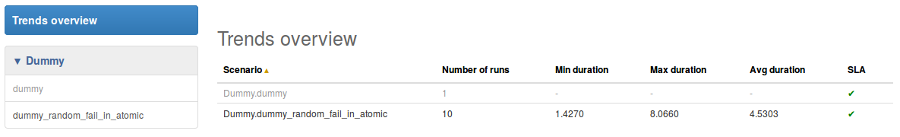
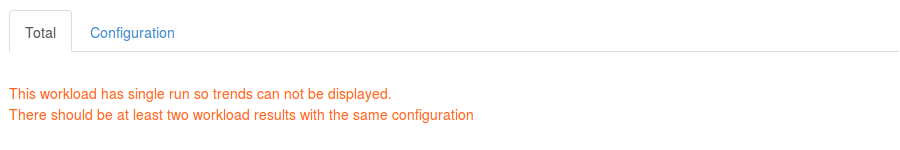
If workload has been actually run only once
That is obvious that it is not possible to have trend for a single value. There should be at least two workload runs to make results comparison possible. So in this case there is only a help message displayed.
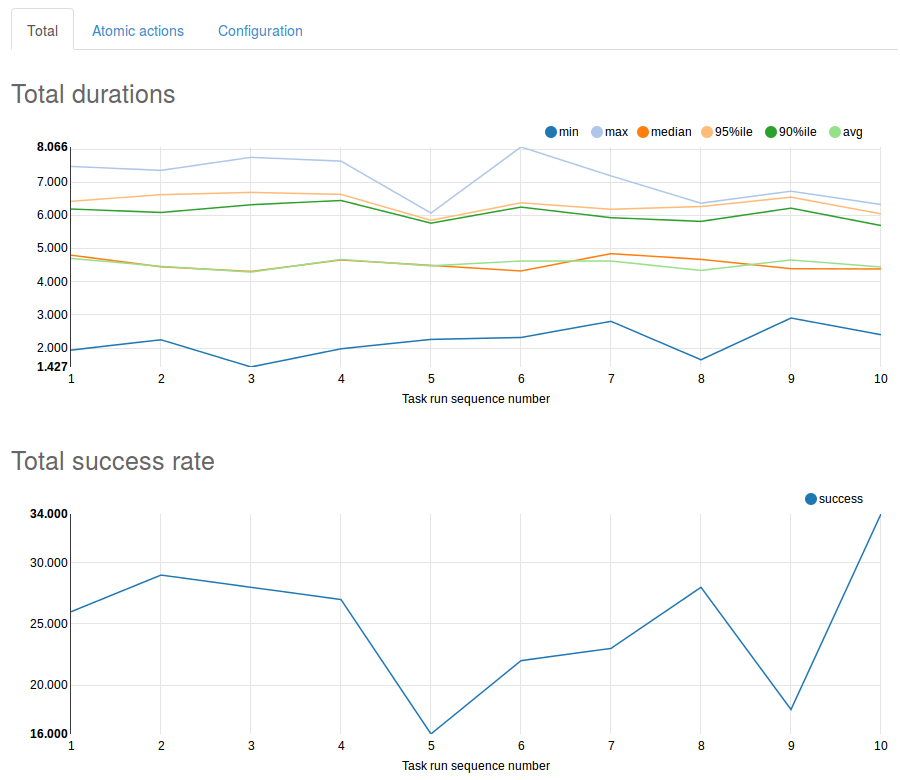
Tab «Total»
Total durations
Shows workload load_duration statistics trends.
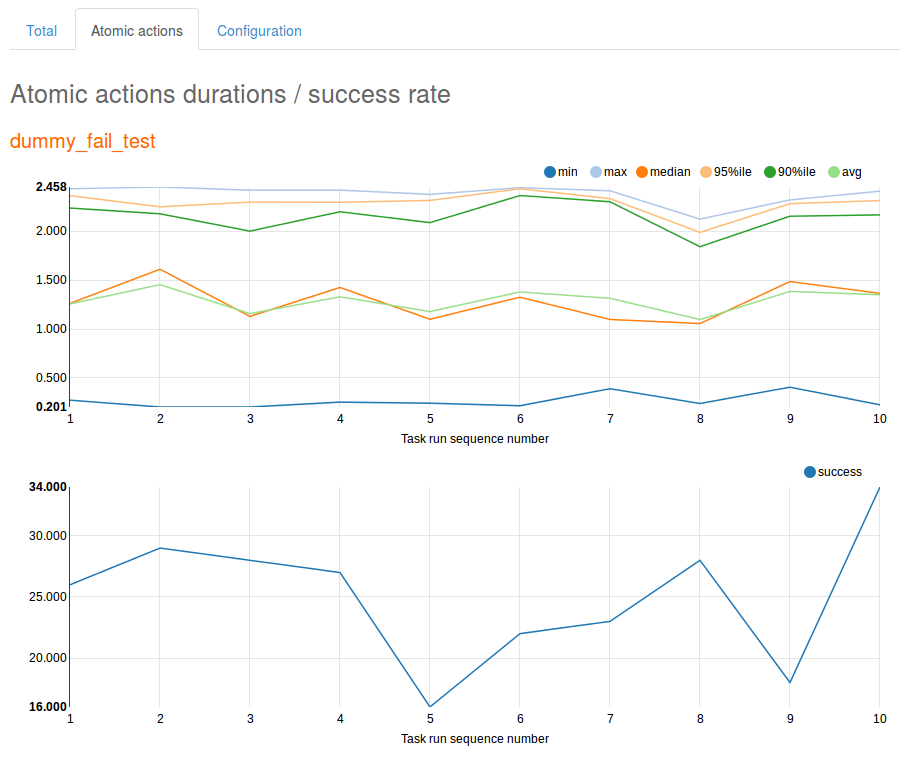
Tab «Atomic actions»
Statistics trends for atomic actions durations. Charts are same as for total durations.
CLI References
For more information regarding Rally Task Component CLI please proceed to CLI reference